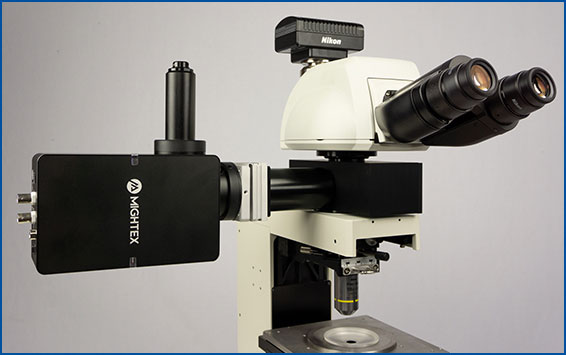
Patterned illumination technologies enable researchers to selectively illuminate parts of their sample for optogenetic stimulation. One application of this is cellular-resolution optogenetics: the ability to selectively illuminate individual neurons within an optogenetic-expressing population (to further understand the difference between widefield and cellular-resolution optogenetics, see this blog post). Beyond this application, patterned illumination can enable researchers to perform more precise and intricate optogenetic experiments.
How can patterned illumination be used in neuroscience optogenetics experiments?
1. Channelrhodopsin-Assisted Circuit Mapping (CRACM) – Kissinger et al. 2020 Cell Reports
2. Focal Optogenetic Stimulation in the Cerebellum – Gruver & Watt 2019 Frontiers in Synaptic Neuroscience
3. Targeted Illumination in Zebrafish – Tabor et al. 2018 Current Biology
4. Targeted Illumination with Patch-Clamp Electrophysiology – Andrasi et al. 2017 PLOS Biology
5. Selective Optogenetic Stimulation with MEA to Detect Spread – Papasavvas et al. 2020 eNeuro
6. Soma-Targeted Optogenetics with Electrophysiology – Anastasiades et al. 2020 Biorxiv
Channelrhodopsin-Assisted Circuit Mapping (CRACM) – Kissinger et al. 2020 Cell Reports
Kissinger et al. 2020 published a paper in Cell Reports examining perceptual deficits in a mouse model of Fragile X syndrome (Fmr1 knockout mice). Previously, their lab showed that visually-evoked low-frequency oscillations occur in V1 during encoding of a familiar stimulus. Kissinger et al. 2020 sought to examine any potential abnormalities in Fmr1 knockout mice low-frequency oscillations during perception and associated circuit changes.
Using local field potentials and single-unit recordings, the authors demonstrated that following the presentation of a familiar visual stimulus Fmr1 mice exhibited shorter duration, lower power, and lower frequency of oscillations in multiple layers of visual cortex.
Kissinger et al. 2020 followed this by investigating any potential connectivity changes in V1 by performing channelrhodopsin-assisted circuit mapping (CRACM) using Mightex’s Polygon DMD Illuminator. Using this technique, the authors were able to examine single-cell connections between cells using optogenetics.
Channelrhodopsin was expressed in control and Fmr1 knockout animals by crossing them with Thy1-ChR2-YFP mice. Naive or experienced animals were sacrificed, and patch-clamp electrophysiology was used to test connections between cells. Specifically, connections between layer 5 – layer 4 and layer 5 – layer 5 cells were tested. While cells were patched, individual cells were stimulated in a 10 by 10 grid (0.67 mm x 0.67 mm) using the Polygon (covering a square from L2/3 to L5). A 470 nm LED light source with 10 ms optogenetic light pulses through a 10x objective was used (0.3 mW under the objective) to stimulate individual neurons.
Kissinger et al. showed a significant potentiation in layer 5 to layer 4 fast-spiking cells in control animals, but no change in Fmr1 knockout animals following perceptual experience. In addition, a significant depression in layer 5 to layer 5 neurons was seen in Fmr1 knockout animals following perceptual experience.
This study demonstrates significant differences in how an animal model of Fragile X syndrome encodes information. As well, using Mightex’s Polygon for CRACM to demonstrate associated circuit changes in Fmr1 knockout mice.
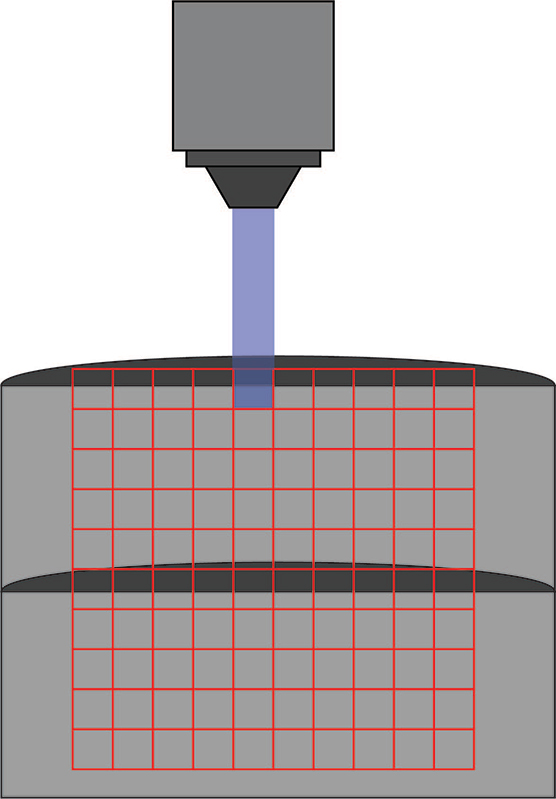
Kissinger et al. 2020 used Mightex’s Polygon DMD Illuminator to scan across a 10 x 10 grid to stimulate individuals areas during a patch-clamp recording.
Focal Optogenetic Stimulation in the Cerebellum – Gruver & Watt 2019 Frontiers in Synaptic Neuroscience
Gruver & Watt 2019 published a paper in Frontiers in Synaptic Neuroscience looking to understand the parameters for focal optogenetic stimulation of purkinje cell somas and axons in the cerebellum using Mightex’ Polygon DMD Illuminator. In addition, they wanted to understand the connections between Purkinje and DCN neurons in the cerebellum using focal optogenetic stimulation.
Cerebellum slices expressed ChR2 and neuronal activity was measured using patch-clamp electrophysiology. While the soma of a cell was patched, the soma or white matter (axon) of that cell was individually illuminated using Mightex’s Polygon DMD illuminator with a 40 um x 40 um square. Focal optogenetic stimulation was performed under a 60x objective with an approximate 100 mw/mm2 intensity at the focal plane.
Gruver & Watt 2019 tested different pulse parameters to determine the ideal optogenetic stimulation to elicit a single action-potential. Longer optogenetic stimulation pulses were required for axons (2-3 ms) compared to soma (1 ms) to elicit a single action potential.
The authors also tested the connections between Purkinje cells and postsynaptic DCN neurons in the cerebellum using focal optogenetic stimulation. The soma of DCN cells was patched and the axon of the presynaptic purkinje cells was focally stimulated (200 um from DCN cells). Gruver & Watt 2019 determined as optogenetic stimulation pulse duration increased, the post-synaptic response in DCN cells increased.
Gruver & Watt 2019 demonstrate a protocol of successful focal stimulation using Mightex’s Polygon DMD illuminator to elicit single action potentials to test neural circuitry in the cerebellum.
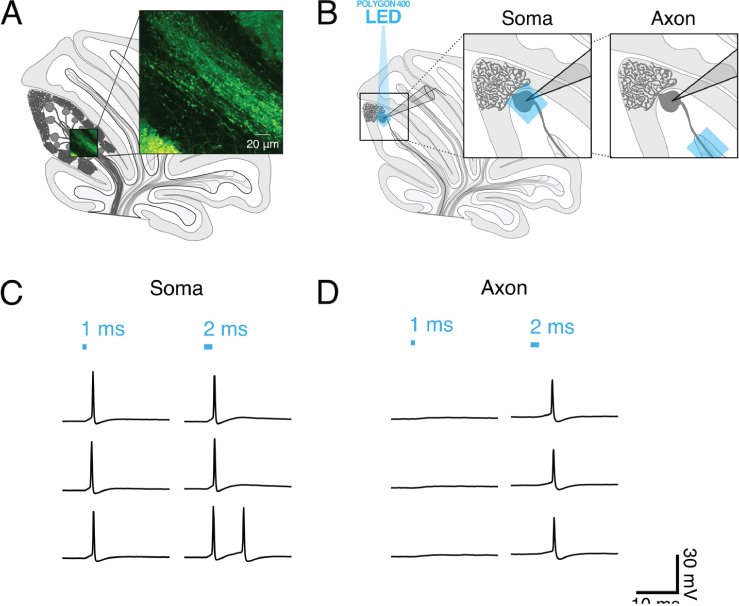
(A) Schematic of sagittal cerebellar slice. Inset is a maximal intensity projection of abtwo-photon stack showing ChR2(H134R)-EYFP expression (green) in axons in the white matter. (B) Recording configuration. Insets show the focal region of photostimulation (blue square) and somatic recording electrode. (C and D) Representative current-clamp traces of optically-evoked action potentials evoked following somatic (C) and axonal (D) stimulation. Blue bars above trace indicate onset and duration of light pulse.
Targeted Illumination in Zebrafish – Tabor et al. 2018 Current Biology
Tabor et al. 2018 examined the cellular-basis of sensory filtering in zebrafish using prepulse inhibition (PPI). PPI is performed by pre-exposing an animal to a mild stimulus, and following this they are presented with an alarming stimulus. A natural response to PPI is a reduction in response to an alarming stimulus due to the pre-exposure.
In their initial experiments, calcium imaging was used to determine that the R4 domain in the zebrafish brain correlated with a PPI response. The authors decided to test whether they could simulate this PPI response by selectively activating the R4 domain in Zebrafish with optogenetics.
Using Mightex’s Polygon DMD Illuminator, Tabor et al. 2018 optogenetically stimulated individual regions in the zebrafish brain expressing ChR2 and measured the PPI response. The Polygon with a 460 nm LED was used to illuminate a 341 um wide square across the hindbrain or smaller regions using 33-50 um wide squares to selectively activate R4 neurons.
Optogenetic stimulation of either the hindbrain or R4 neurons suppressed the startle response when the pulse was presented 400ms after illumination. This response was not inhibited when neurons fired during the pulse-alone or before the stimulus. In this paper, Tabor et al. 2018 demonstrate a brainstem motor circuit for PPI in zebrafish to test sensory gating.
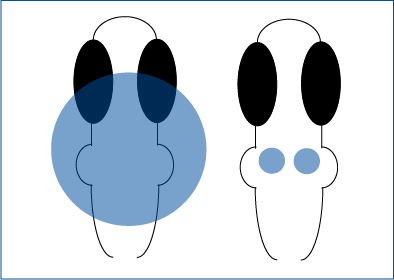
Tabor et al. 2018 selectively activated hindbrain neurons or R4 neurons in zebrafish.
Targeted Illumination with Patch-Clamp Electrophysiology – Andrasi et al. 2017 PLOS Biology
Andrasi et al. 2017 investigated the connectivity between pyramidal neurons and interneurons in the basal nucleus of the amygdala and how these interactions regulate activity. They explored these questions using a variety of methods including optogenetics, patch-clamp electrophysiology, and microscopy techniques.
In one experiment, the authors tested whether cholecystokinin (CCK) and parvalbumin (PV) interneurons receive direct input from pyramidal neurons in the amygdala. Andrasi et al. tested this by optogenetically stimulating surrounding pyramidal neurons that expressed ChR2 while recording the activity of CCK or PV interneurons with electrophysiology. By using Mightex’s Polygon DMD Illuminator, Andrasi et al. were able to illuminate individual cells using 15-20 um spots for 50ms of blue light on randomly chosen pyramidal cells surrounding the interneurons. The post-synaptic response following optogenetic stimulation was measured in CCK or PV cells.
The authors demonstrated using cellular-resolution optogenetic stimulation that pyramidal cells were more likely to be connected to PV interneurons than CCK cells. In addition, using the XY coordinates of the record cell and distance from the optogenetically stimulated pyramidal soma, they created a connectivity map. They demonstrated that PV cells were connected to closer pyramidal cells, rather than long distance, and CCK connections were not dependent on distance. In conclusion, this paper showed different functions for PV and CCK interneuron cell networks in amygdala.
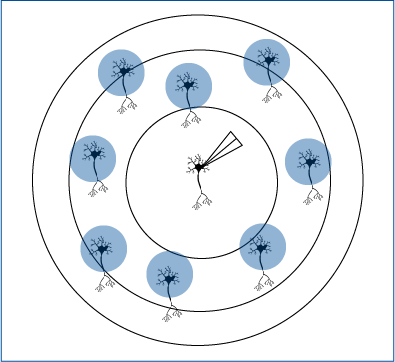
Andrasi et al. 2017 selectively activated surrounding pyramidal cells to test connections with interneurons.
Selective Optogenetic Stimulation with MEA to Detect Spread – Papasavvas et al. 2020 eNeuro
Interneurons are directly connected by gap junctions to other interneurons, and this provides a highly specific excitatory link. It is relatively unknown how gap-junction mediated propagation may be linked to increased activity. Papasavvas et al. 2020 tested the hypothesis that raised extracellular potassium levels may be associated with extreme levels of neuronal activity.
To test this hypothesis, the authors recorded electrophysiological activity in slices with normal or increased potassium levels, and they used optogenetics to activitate parvalbumin-expressing interneurons with ChR2. Field potentials were measured using a MEA placed along layer V of the occipital cortical slices. Mightex’s Polygon DMD Illuminator was used to illuminate three to four adjacent electrodes (300-400um x 10 um square) with a 470nm LED. The experiments were performed under a 4x objective, yielding an approximate 2 mw/mm2 of intensity under the objective. Following optogenetic stimulation, the spread of activity was measured and sampled at 100um spaces between individual electrodes in conjunction with pharmacological manipulations.
Papasavvas et al. 2020 showed at baseline extracellular potassium levels that neural activity was limited to the electrodes illuminated. However, by increasing potassium levels, there was increased spontaneous activity and a time-locked burst of firing at least 150um away from recording sites following optogenetic stimulation. The proportion of slices that showed propagation from the illumination site increased with the associated extracellular potassium levels. In this paper, Papasavvas demonstrate using patterned illumination and MEA recordings that extracellular potassium levels affect the spontaneous activity of interneurons.
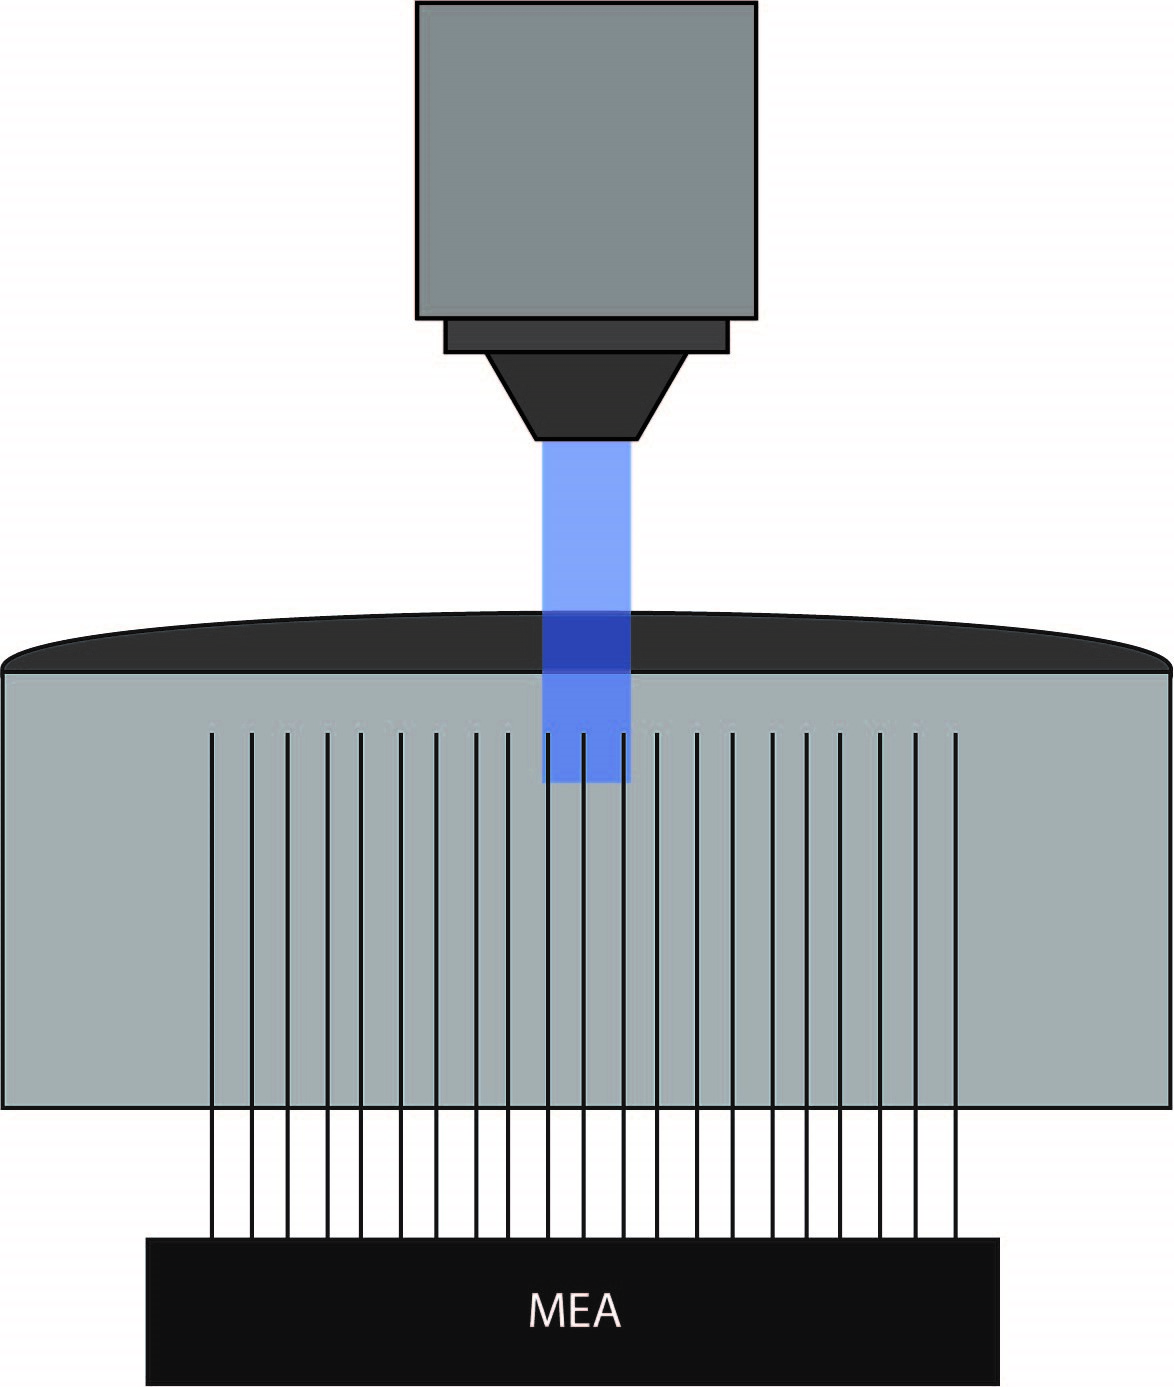
Papasavvas et al. 2020 used Mightex’s Polygon DMD Illuminator to illuminate only specific electrodes on the MEA.
Soma-Targeted Optogenetics with Electrophysiology – Anastasiades et al. 2020 Biorxiv
There are reciprocal connections between the prefrontal cortex (PFC), mediodorsal (MD), and ventromedial (VM) thalamic nuclei. However, how these different thalamic nuclei communicate with the prefrontal cortex is unclear. Anastasiades et al. 2020 set out to understand the nature of these connections using techniques such as anatomical tracing, electrophysiology, and optogenetics.
The authors first demonstrated using anatomical tracing that the VM projections were found in layer 1a of the PFC and MD projections in layer 1b of the PFC. Specifically, it was found that NDNF+ cells receive inputs from VM in layer 1a of the PFC, and VIP+cells receive inputs from MD in layer 1b in MD. These findings suggested separate PFC-thalamic circuits.
With these direct connections established, Anastasiades et al. 2020 investigated how these different cell types—that receive direct input from the thalamus—communicate within local PFC circuits. They recorded responses from local parvalbumin interneurons, somatostatin interneurons, and pyramidal neurons following optogenetic stimulation of NDNF+ and VIP+ cells that expressed ChR2. Interestingly, VIP-evoked IPSCS occurred only in somatostatin interneurons, but not pyramidal cells or parvalbumin interneurons. Conversely, NDNF+-evoked IPSCS occurred in parvalbumin interneurons and pyramidal cells, but not somatostatin interneurons. These findings extended upon the author’s previous experiments by demonstrating distinct microcircuits within the PFC.
The authors showed that the connection between NDNF+ cells and pyramidal cells was not limited to PFC Layer 1. Soma-targeted optogenetics was used to identify the location of NDNF+ cells connected to pyramidal cells. NDNF+ cells expressed optogenetic construct st-Chrome, which was activated by blue light. Mightex’s Polygon DMD illuminator with a 473nm LED was used to illuminate a 10 x 10 pseudo-random grid (mapping area of 750um x 750um) under a 10x objective. Subsequent responses were measured in pyramidal cells using electrophysiology.
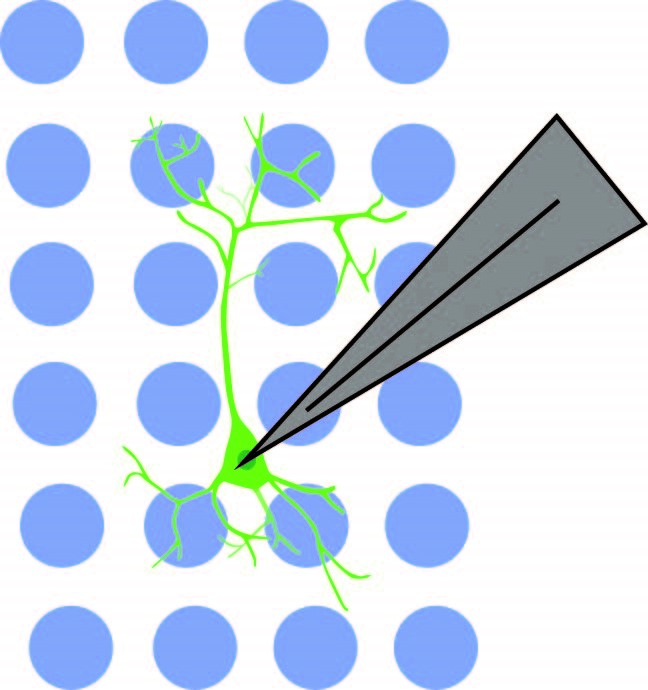
Anastasiades et al. 2020 used Mightex’s Polygon DMD Illuminator to optogenetically stimulate individual interneuron somas while recording from a pyramidal neuron.
First, the authors established the parameters for st-Chrome soma-targeted optogenetic activation. Activation was only detected when the soma was directly illuminated, and no response was detected when the illumination spot was 75um from the soma. The authors showed using soma-targeted optogenetics that pyramidal cells receive input from NDNF+ predominantly in Layer 1, but also receive some input from Layers 2/3 and 5. In this paper, Anastasiades et al. 2020 show an intricate long-range PFC-thalamic circuit.
Interested in Patterned Illumination for Optogenetics?
Click here to learn more about Mightex’s Polygon pattern illuminator for cellular-resolution optogenetics.
