


with the Mightex Polygon
Published on 2024/02/14 Research powered by Mightex’s Polygon1000 ![]()
 Bhuvanasundar Renganathan & Vladimir I Gelfand, Visualizing Vimentin Filament Dynamics Using Photoconversion with the Mightex Polygon. Northwestern University, (2023).


The primary focus of our research revolves around the dynamics of vimentin intermediate filaments (VIF), a major cytoskeletal protein. To visualize intermediate filament dynamics, we employ the photoconversion technique, wherein a fluorescent molecule undergoes a transformation in its fluorescence properties upon exposure to ultraviolet (UV, 405 nm) light. In our experiments, we utilize mEos3.2, a photoconvertible fluorescent protein that transitions from a green to a red fluorescence state upon UV illumination.
The distribution of VIFs across the cell exhibits remarkable diversity. To gain insight int the transport of individual filaments, especially in regions densely populated with vimentin filaments, we harness the power of local photoconversion with our Mightex polygon DMD Illuminator system. This effective tool enables us to confine the photoconversion process within a precise Region of Interest (ROI) in the desired area of the cell. The Mightex polygon system provided us with the flexibility to robustly investigate the transport behavior of vimentin in various regions of the cell.
In the context of vimentin, this selective photoconversion of a subset of filaments within the intricate network grants us the ability to dissect the behavior of a few filaments. Consequently, photoconversion creates fiduciary marks on the filaments, facilitating our ability to track filament transport using time-lapse imaging with Total Internal Reflection Fluorescence Microscopy (TIRFM) or spinning-disk confocal microscopy in the red channel, where photoconverted mEos3.2-vimentin fluoresces. This not only allows us to demonstrate the transport of mature filaments through the cell but also enables quantification of filament transport. Such a method will greatly facilitate future studies aimed at determining the mechanisms and regulation of filament
transport.
As a result, combination of photoconversion with live-cell time-lapse imaging emerges as a powerful approach, enabling us to closely monitor and gain profound insights into the transport and remodeling of vimentin filaments within the intricate network of the cell. Utilizing this approach, we can also study the dynamics of other cytoskeletal proteins, such as microtubules, and the dynamics of other subcellular organelles.
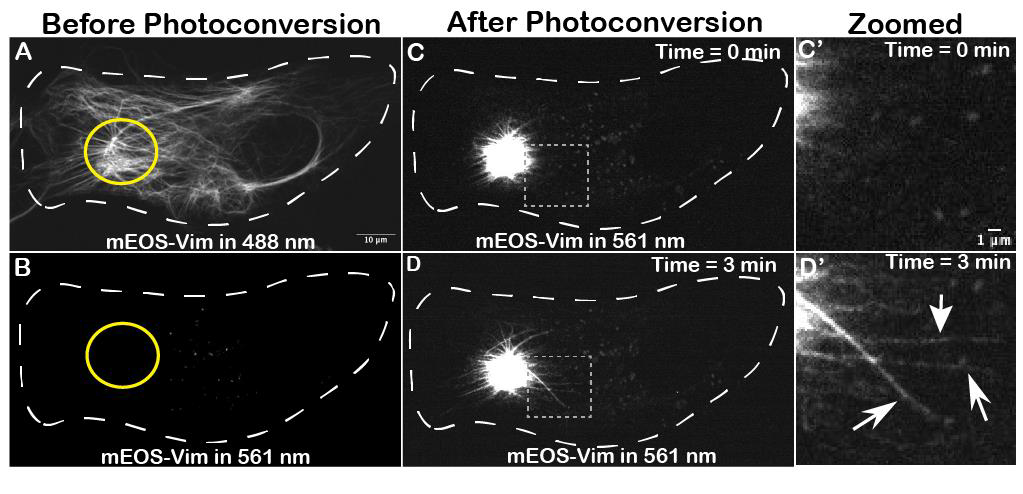
Figure 1: Photoconversion of mEOS-vimentin in RPE cells using Mightex polygon and imaged with spinning disk confocal microscopy.
Panels A and B: Images captured under the green channel (488 nm) and red channel (561 nm) before photoconversion, respectively. These panels display the distribution of green-fluorescing vimentin filaments and the absence of fluorescence in the red channel. mEOS-vimentin was selectively photoconverted from green to red fluorescence within a specific region by illuminating it with 405 nm light using the Mightex polygon for 3 seconds. After Photoconversion, images were collected in red channel for a total of 3 minutes at 15-second intervals.
Panels C and D: Images obtained under the red channel at 0 minutes and 3 minutes after photoconversion, illustrating the dynamic transport of the photoconverted vimentin filaments. The regions outlined by gray boxes are magnified and presented below in panels C’ and D’.
Panel D shows several photoconverted filaments present outside of the original photoconverted zone after 3 minutes. The presence of red-fluorescing filaments outside the photoconversion zone indicates the active transport of photoconverted filaments. Panel D’ is the zoomed image of the gray box in panel D.
The white dotted line marks the cell boundary, the yellow solid circle designates the photoconversion zone, and the gray dotted box delineates the zoomed area. The white arrow points to photoconverted red filaments outside the photoconversion zone.
Video 1: Active transport of vimentin filaments (mEOS) in RPE. A 10 μm-diameter area of a mEOS_Vim was photoconverted from green (488 nm) to red (561 nm) with 405nm light (see yellow circle). The movie shows the transport of red vimentin filaments outside of the
photoconverted area every 15 sec after photoconversion for 3 min.
Video 1
Author: Bhuvanasundar Renganathan, PhD
Bio: Doctor of Philosophy (Biological sciences) – Birla Institute of Technology and Science, Pilani, India
Master of Sciences (Medical lab technology) – Birla Institute of Technology and Science, Pilani, India
Bachelor of Sciences (Biochemistry) – University of Madras, Chennai, India