


in neonatal rat atrial monolayers
using patterned illumination
Published on 2024/01/29 Research powered by Mightex’s Polygon ![]()

Tim De Coster, & Daniël A. Pijnappels, Discovering a new cardiac arrhythmia mechanism in neonatal rat atrial monolayers using patterned illumination. Laboratory of Experimental Cardiology, Leiden University Medical Center, (2023).


Short Research Description
Understanding how cardiac arrhythmias initiate and maintain themselves is essential for developing novel medical intervention methods. Most cardiac phe-nomena have an explanation already, but sometimes contradictions arise that ask for novel insight and out-of-the-box thinking. One such ’contradiction’ is the observation of patients’ electrogram signals that show abnormal behaviour in a small region, while the rest of the heart shows normal/sinus rhythm. We formulated a hypothesis for a possible mechanism that could underlie these unconventional dynamics.
Our proposed mechanism consists of a small electri-cally isolated region inside a main body of excitable cardiac cells. This small area would be connected to the rest of the cells by a small connective bridge/isth-mus. Electrical excitation waves would then be able to rotate inside this small electrically isolated region (which is called reentry) without affecting the rest of the cells (and giving rise to local abnormal elec-trograms), thereby effectively being ’trapped’. For this reason, we call this phenomenon ’trapped reen-try’. However, under changed isthmus properties, the trapped signal might abruptly escape, resulting in an arrhythmia.
By combination of computational pattern design for the Mightex PolyLite software with optogenetic manipulation of cardiac monolayers using the Migh-tex polygon 400 and a 470-nm Mightex high-power collimator light-emitting diode (LED) 50W type-H source (Fig. 1.1), we aimed to test our hypothesis of trapped reentry.
This set-up could reach the needed spatio-temporal control over the excitable cardiac cells to construct a small electrically isolated circuit in which we could induce propagating electrical waves (Fig. 1.2 A-B and Videos 1-2). Shining specific light patterns using the polygon 400 onto the optogenetically modified cardiac cells elevated their membrane potential resulting in effective conduction block in any illu-minated region. By looking at the measured signal traces inside the isolated region and outside, we could observe a difference in frequency (Fig. 1.2 C1-C2). The higher frequency takes over the whole tissue when the isthmus is changed (Fig. 1.2 C3).
Activation maps showing the two distinct electrically conducting regions (Fig. 1.2 D) were used to quantify frequencies and conduction velocities ((Fig.1.2 E-F). To verify that the escape of the waves from the isolated region could be ascribed to what we call ”source-sink-mismatch” (a phenomenon where excitation waves block in one direction and propagate in the other), we carried out additional experiments that gradually changed isthmus width within a rectangle (Fig. 1.2 G-H). Resulting conduction velocities were plotted against the isthmus width (Fig. 1.2 I). We concluded that our hypothesis of ’trapped reentry’ was correct, and that it might be the underlying cause of the peculiar observation of abnormal electrograms under normal cardiac rhythm.
These results were recently accepted in Cardiovascular Research.
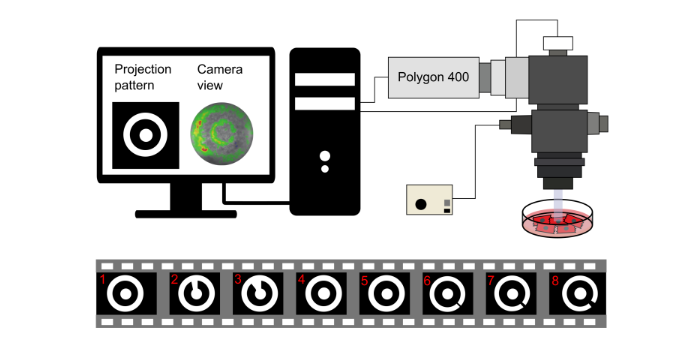
Figure 1.1: Experimental set-up. Schematic view of the optical mapping set-up used to carry out the in vitro experiments. The patterned illuminator (Mightex Polygon 400) shines light using the Mightex PolyLite software according to the patterns depicted in the eight movie frames at the bottom to first trap and subsequently release a reentrant wave.
Video Legends
Video 1: Experimental trapping of excitation waves in a neonatal rat atrial mycoyte culture: Essential steps to experimentally realise trapped reentry (Experiments shown in Figure 1.2 A-F and I). Voltage signals are made visible by means of a fluorescent dye. The timer indicates real-time elapsed seconds. The drawings at the bottom depict the sequence of different illumination patterns used to generate the camera output shown at the top.
Video 2: Sinus rhythm through a narrow funnel in a neonatal rat atrial mycoyte culture: Wave propagation through a funnel with a straight border (Experiments shown in Figure 1.2 G, H and I). Visualisation steps are the same as in Video 1.
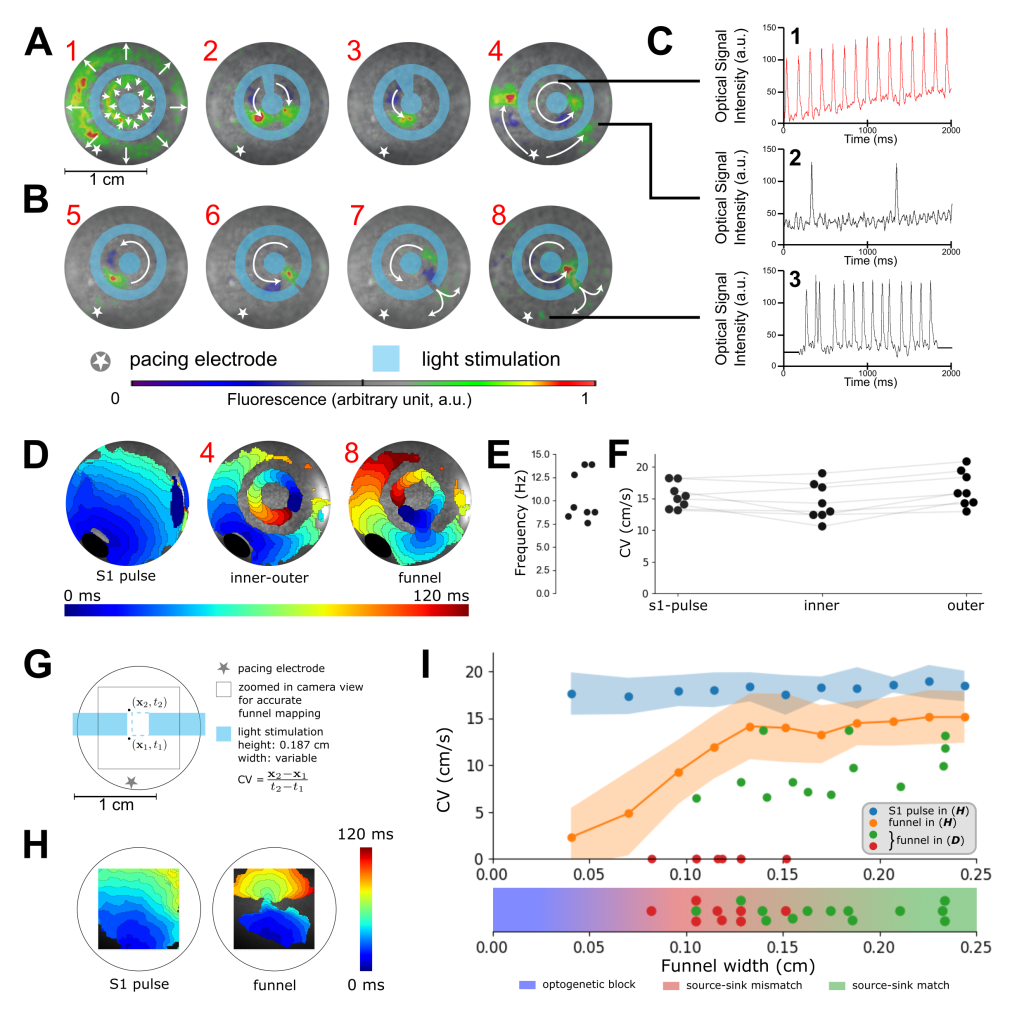
Figure 1.2: In vitro realization of trapped reentry. A, Procedure to initiate a trapped reentrant wave (n=8 biological replicates). The light blue color shows the illumination pattern used to locally inactivate the tissue. White arrows superimposed on the optical mapping data depict wave propagation. The radially moving waves in A1 occur upon the onset of illumination. B, Opening of the optogenetically isolated circuit of conduction with non-illuminated areas (isthmi) of increasing width, such that escape of the trapped wave can occur. C, Voltage traces at representative points showing trapped reentry with SR in the surrounding bulk tissue in A4 and escape of the reentrant wave through an isthmus in B8. D, Activation map of optogenetically modified NRAM monolayer showing trapped reentry. E, Rotational frequencies of trapped excitation waves. F, Conduction velocities (CVs) in different regions of the trapped reentry circuit. The paired Wilcoxon groups signed rank test with α = 0.05 showed no significant difference in CV comparing SR and trapped reentry. G, Scheme showing how funnel CVs were measured in optogenetically modified NRAM monolayers (n=5 biological replicates). H, Activation maps of optogenetically modified NRAM monolayers exposed (right) or not exposed (left) to the illumination pattern shown in (G). I, CVs as a function of funnel width for the experiments shown in (A-F) and in (G-H). The red and green dots represent failed and successful release of excitation waves from the reentrant circuits, respectively. The blue and orange dots correspond to NRAM monolayers without and with an optogenetically imposed rectangular conduction block (i.e. before and after blue light stimulation as shown in (G)), respectively. Data of the experiment of (G-H) are presented as average ± standard deviation (blue and orange shaded areas, n=5 biological replicates).
Author: Tim De Coster, PhD
Bio: Tim De Coster, PhD, is a distinguished expert in mathematical modeling and computational methods, particularly focusing on the biophysics of cardiac arrhythmias. His academic journey began with a Master’s degree in Theoretical Physics from KU Leuven in Belgium. He then embarked on a multidisciplinary PhD journey, spanning both the Physics department at UGent and the Biomedical Sciences department at KU Leuven. Under the guidance of mentors Sasha Panfilov, Piet Claus, and Karin Sipido, Tim’s research explored the impact of adipose tissue on the development of cardiac arrhythmias, examining both structural and electrical modifications in the heart.
In 2018, Tim joined the Laboratory of Experimental Cardiology, focusing his research on biological cardiac defibrillation, with support from the European Research Council (ERC). His current and future work, backed by a NWO Off Road grant, aims to decipher the mechanisms behind spontaneous termination of arrhythmias. Tim is dedicated to using this knowledge to fortify the heart, reducing its susceptibility to sustained arrhythmias, and contributing significantly to the field of cardiac health.