




1. Introduction
Fiber photometry is a relatively simple method for recording neural activity in vivo. But despite its simplicity, the best fiber photometry experiments require careful planning. There are various options for different hardware configurations, integration with behaviour systems, GEFIs, transgenic animals, and signal processing strategies. As with any methodological approach in neuroscience, a researcher’s first task is to answer a series of key questions:
- Is fiber photometry the correct method for this scientific question? (See the first eBook in our Fiber Photometry series for an overview of this issue: An Introductory Primer on Fiber Photometry).
- How should my photometry recording protocol be designed?
- Which animal line and/or GEFI should I use? How should I deliver it, and to which brain regions?
- What hardware configuration is required for this experiment?
This eBook will help you answer these questions and more by providing some in-depth tips for experimental design, validation of sensors, hardware configuration, and best practices for collecting the best possible photometry data.
1.1 Experimental Design for Fiber Photometry
1.1.1 Logistics of Recording
Constraints on Recording Duration
One very important feature of GEFIs is their susceptibility to photobleaching, the phenomenon whereby the fluorescence output of a fluorophore decreases as a function of the intensity and duration of excitation light. Although GEFIs are continually recycled and produced in the expressing cells, this means that after a long recording, there will be a period in which the fluorescence response must recover from photobleaching. When designing experiments, careful consideration must be given to the length of recording sessions. There are examples of researchers collecting long-term, chronic photometry recordings to study, for instance, circadian rhythms. In these cases, one way that the photobleaching issue is dealt with is to reduce the duty cycle of the excitation light to reduce the power density to the target region 1. Another option may be to collect signals during specific epochs and turn the excitation light off for irrelevant epochs.
Constraints on Animal Movement
Another basic obstacle in designing photometry experiments is the fact that animals are tethered via a subject patchcord during recording. The patchcord adds some weight and resistance to animals’ locomotor activity and can cause stress or distraction to the animal during behavioural testing. The effect on animals’ performance can be significant enough to mask the effects of experimental variables. To minimize the potential confounding effects of the fiber patchcord on behaviour, it is necessary to habituate animals to the fiber patchcord before any critical behavioural data are collected. Some options include combining this patchcord habituation with the habituation and early pre-training steps of an operant task or with initial test recordings for signal verification, where normal animal behaviour may be less critical. Regardless, animals should ideally be connected to the patchcord and allowed to habituate to it over several sessions spanning multiple days, preferably within the apparatus where experimental data will be collected.
Interference with other Methods or Hardware
Following from the previous point, the presence of a subject patchcord introduces another hurdle. The recording apparatus, whether it’s an operant chamber, a maze, or otherwise, must be designed or modified so that a fiber patchcord can enter the recording chamber and have free movement without becoming caught on objects within the apparatus. This will usually require an open port at the top of the chamber through which the patchcord can travel. The patchcord must be able to effectively move past any protrusions within the chamber, lest it becomes stuck on something and prevents the animal from moving. Features such as nose-poke ports and feeder magazines must also be designed to accommodate animals’ headcaps and connected patchcord.
1.1.2 Selecting a GEFI and Expressing it in Target Cells
GEFI Mechanisms of Action and Type of Readout
Understanding the type of GEFI you are selecting, its mechanism of action, and the type of readout is critical. These factors will determine the excitation wavelengths and optics your photometry system will need to contain. GEFIs have a variety of mechanisms of action, but all generally function by undergoing a conformational change that tracks the dynamics of the underlying biological target (e.g. ligand binding, voltage changes). However, the underlying mechanism by which the GEFI reports activity dynamics, as well as the type of readout, can have major implications for experimental design and data interpretation.
The structure of GEFIs most commonly consists of an activity-sensing domain and a fluorescent reporting domain. The activity-sensing domain can take a variety of forms, but generally will be a molecular structure that binds to a ligand, undergoes an activity-dependent change in its protonation state, or another similar mechanism. This conformational change then causes a change in the fluorescent output of the activity reporting domain.
The change in fluorescent output is often “intensiometric”, manifesting as a change in brightness, with ligand binding either causing an increase in brightness or a decrease (inverse sensors). Some GEFIs are “ratiometric”, and activity dynamics are reflected in the ratio of brightness between two fluorophores that exchange energy via Förster Resonance Energy Transfer. Although this type of GEFI requires a more specialized spectral configuration, the read-out is still a change in the brightness of fluorophores.
While the previous two types of GEFI read-out both rely on brightness, activity dynamics may also manifest as a change in fluorescence lifetime, or the lag time between a fluorophore’s absorption of excitation photons and the subsequent fluorescence emission. There are several GEFIs for which fluorescence lifetime is the intended read-out. Measuring changes in fluorescence lifetime requires a specialized system, and this type of read-out cannot be acquired using standard fiber photometry hardware.
GEFI Kenetics
The kinetics and fluorescent dynamic range of GEFIs typically present some tradeoffs chiefly between speed, brightness, and ligand selectivity. As such, GEFIs now commonly come in multiple versions. For example, GCaMP comes in fast, medium, and slow versions (denoted as “f”, “m”, or “s” at the end of “GCaMP”). Similarly, GRAB sensors come in different versions which are fine-tuned either for acceptable selectivity + high brightness or exceptional selectivity + reduced brightness (compared to the bright versions). High speed and selectivity are always desirable, but if achieving sufficient brightness in your target cell population is a challenge, you can consider slower or somewhat less selective versions. After all, collecting enough emission light to observe dynamics is the basic requirement to have a successful fiber photometry experiment.
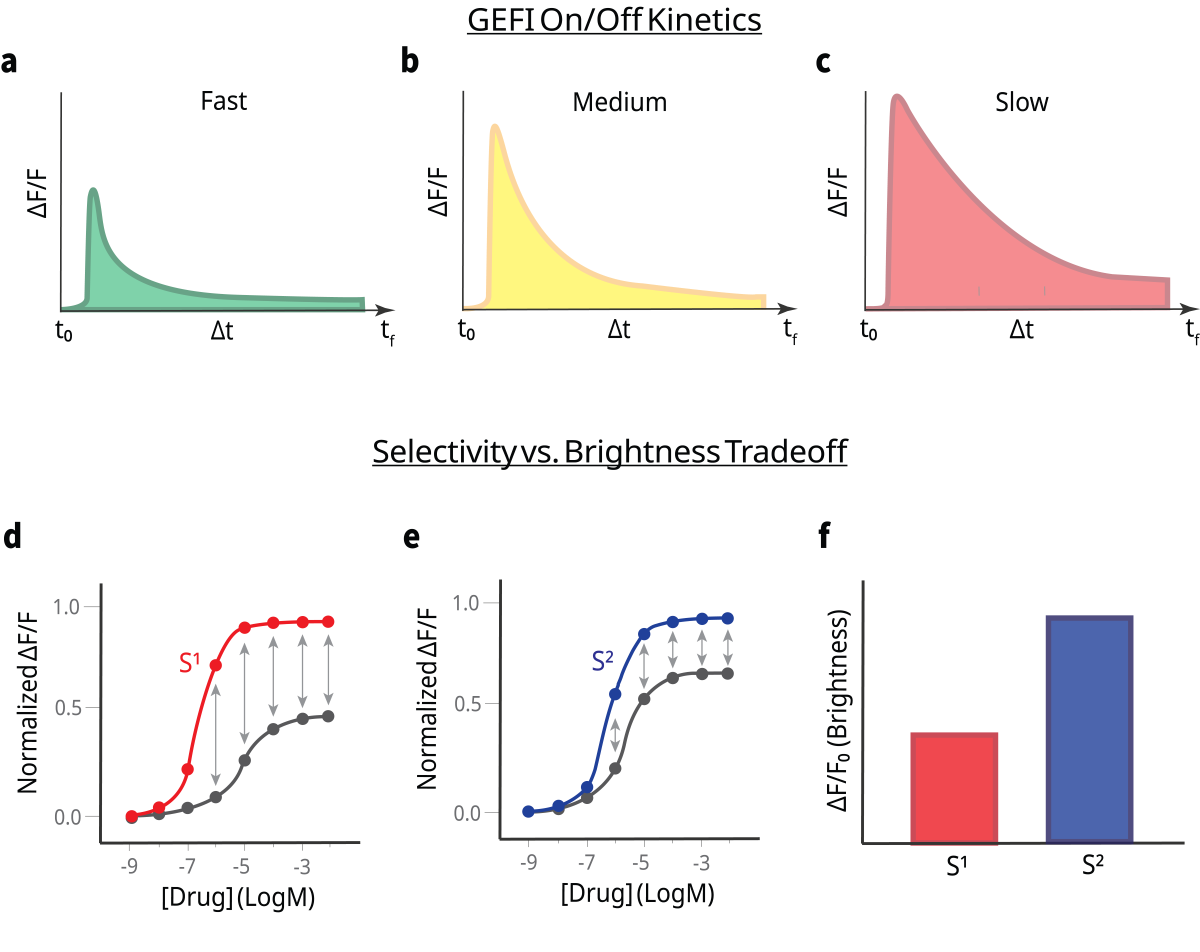
Figure 1. Illustration of the kinetic and fluorescent dynamic range tradeoffs in genetically encoded fluorescent indicators (GEFIs). The upper panel illustrates kinetic variants fast (f), medium (m), and slow (s) on/off kinetics, as exemplified by sensors such as GCaMP, highlighting differences in response speed and brightness signal. The lower panel depicts the balance between ligand selectivity and brightness, as seen in neurotransmitter sensor variants optimized either for higher fluorescence output with moderate selectivity or for exceptional selectivity with comparatively reduced brightness.
Transgenic Expression of GEFIs
There is now a considerable variety of commercially available transgenic rodent lines that constitutively express a GEFI in defined cell subtypes. These animals need only be implanted with a fiber and given sufficient time for surgical recovery and the clearance of blood and inflammation from the recording site. By mitigating the need to wait additional weeks for optimal expression of a viral construct, this approach can be advantageous for tight experimental timelines.
Viral Expression of GEFIs
When working with a new GEFI/viral vector in a new brain region, it is advisable to perform experiments in which you titrate the concentration and infusion volume of your virus. Too little expression of your GEFI will obviously lead to a weak signal. Overexpression of your GEFI, on the other hand, can alter the activity of neurons and lead to cell death. For example, GCaMP can buffer calcium 3, cause aberrant activity 3,4, and cytotoxicity 5,6. One recommendation for GCaMP, in particular, is to avoid levels of expression that result in nuclear filling, as this can induce cytotoxic alterations in gene expression 7.
For fiber photometry, the spatial spread of viral expression matters relatively little, provided there is expression within the light collection field of the fiber and the fiber and expressing cells are within the target structure. However, injecting a very high volume may introduce enough virus to the target region that the infected cells overexpress the GEFI and this could lead to the overexpression problems discussed above. If the intent is to genetically target a GEFI to a specific cell-subtype, overadministration of the viral vector could also increase the severity of so-called “leaky expression”, in which off-target cell subtypes also express the GEFI.
Fiber Optic Probe Characteristics, Selection, Testing
Fiber photometry experiments require the implantation of an indwelling fiber optic aimed at the cell population/region of interest. There are multiple options and multiple important factors to consider. The most common configuration used in fiber photometry is a flat-cleaved fiber with a 400µm core diameter. Several characteristics affect the size and shape of the line cone exiting the fiber, and hence the effective field of stimulation/light collection. The size of the light cone increases with both core diameter and numerical aperture. However, it should be understood that the actual volume of brain tissue from which a photometry signal can be collected with typical fiber implants is relatively small – i.e. fractions of a cubic millimeter 8.
If fiber optic implants are purchased commercially precut to the intended length, the manufacturer will typically guarantee high, consistent light transmission efficiency. Alternatively, fiber probes may come in a standard length (e.g. 20mm) and must be cut to length by the researcher using a ruby scribe. In either case, it is best practice to always test the light transmission efficiency of the fibers to ensure quality. Fiber optic probes will never have 100% efficiency because some power is always lost at the interface between the tip of the patchcord and the top of the implanted probe. A reasonable benchmark is an absolute minimum of 70% efficiency (but ideally as high as possible). Using a light meter and compatible sensor (ideally with a fiber adaptor) such as those sold by Thorlabs, carry out the following steps:
- Set your power meter to the wavelength you intend to use for power measurements. This can be any wavelength, but testing the wavelength of your signal channel is likely the most logical approach.
- Measure the output (µW) of a patchcord connected to your light source.
- Then connect the patchcord to a fiber optic implant and measure the output again.
- The light transmission efficiency can be measured as:
Efficiency (%) =
Outputpatchcord + fiber implant
Outputpatchcord only
× 100
Outputpatchcord + fiber implant
Outputpatchcord only
× 100
One final, brief note is that fiber ferrules with some sort of notch or bezel are preferable to completely smooth ferrules. Dental acrylic does not chemically bond with metal ferrules and instead relies on the mechanical interface between the headcap and the ferrule. It is not unheard-of for smooth ferrules to occasionally pull out of the headcap during recording procedures.
1.1.3 Experimental Timeline and Due Diligence Steps
Surgical Timeline
Animals undergoing fiber photometry recording require stereotaxic surgery to virally express a GEFI and implant fiber optic probes. These surgeries entail a timeline for surgical recovery and waiting for peak viral expression which must be taken into account when planning. Post-operative recovery typically requires around 1 week and, depending on the viral vector, an additional 3-4 weeks are required for the recording site to be free of blood/inflammation and for the targeted cell population to show peak viral expression.
An additional question is whether to conduct surgeries at the beginning of an experiment or after animals have e.g. been trained in some behavioural task. Stable viral expression and repeated photometry recordings can be conducted for many months after animals have undergone surgeries, but every additional unit of time wherein animals have implants and are being connected/disconnected adds risk of attrition due to fiber optic implants being damaged or headcaps coming off. Animal attrition is obviously a far more costly mishap when the animals have undergone extensive behavioural training or other time-consuming procedures. Thankfully, following best practices for surgeries, animal housing, and recording sessions can largely avoid this problem, but it is good to be aware of these risks during experimental planning especially if the animals themselves were extremely costly.
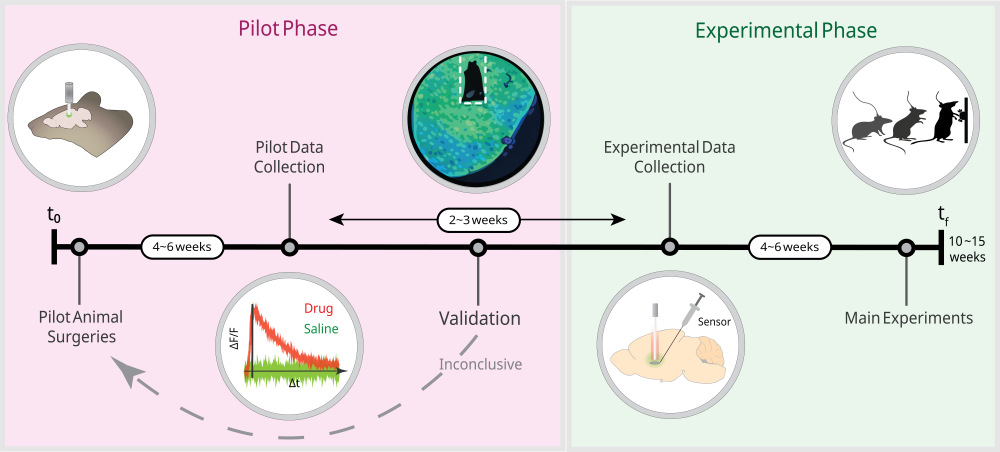
Figure 2. This illustration outlines the basic recommended sequence and approximate timing/duration of pilot experiments, surgical preparation and experimental validation at the beginning of main experiments. Every new photometry protocol requires a series of due diligence steps to validate the signal and GEFI expression before data is collected in main experimental animals.
Verification and Control Experiments
Before commencing any main experiments – especially those involving critical animals that have been specially bred or undergone time-consuming behavioural procedures – it is critical to conduct control experiments (pilot surgeries, recordings, test surgeries and histology/microscopy). You should make certain that you’re recording a real, activity-dependent signal, and that your surgical protocol results in sufficient expression of your sensor or opsin in the target region/population. Photometry recordings can exhibit spurious signal dynamics that reflect artifact, not activity. Viral expression can vary greatly depending on AAV promoter, serotype, constitutive vs cre-driven constructs, cell population, and brain region, among other factors.
Verification of Your Fluorescent Signal
After your first group of pilot animals have recovered from their fiber implant surgeries, and time has been allowed for optimal sensor expression, your first step is to conduct positive and negative control experiments with drug treatments or behavioural stimuli appropriate to the sensor. For example, if you are recording a neurotransmitter sensor, you should administer a high affinity, specific antagonist that blocks that sensor and observe whether your analyzed fluorescent signal is diminished compared to a vehicle treatment. Conversely, you should also administer a specific reuptake inhibitor of that neurotransmitter and observe whether your signal, relative to a vehicle treatment, is increased. There are also behavioural approaches to conducting positive and negative controls. A dopamine sensor expressed in the nucleus accumbens, for example, should exhibit the well-known responses to reward prediction error. If there are no straightforward pharmacological means by which to verify your signal because of a lack of specific ligands, behavioural controls are a viable alternative provided you have hypotheses about how your signal should behave that are extremely well-grounded in reliable literature – beware of circular logic and reverse inferences!
Histological Verification
Having validated the photometry signals from your pilot animals, you must then verify that your GEFI and fiber implant have targeted the correct cell population. If you are genetically targeting a specific cellular subtype, you must also perform co-localization studies to ensure that your GEFI has been targeted to the correct cellular population. At this stage, pilot animals must be sacrificed for histological analysis.
A detailed explanation of the principles of histology, immunohistochemistry, and microscopy is beyond the scope of this document, but a brief comment on some key considerations is warranted here. Many sensors, in spite of having a fluorophore domain, still require immunostaining to image reliably (e.g. using an anti-GFP primary antibody). Additionally, the track left by a 400µm core fiber is small and can be difficult to locate in tissue sections, leading to difficulties confirming fiber placement. Reliable locating of the fiber track requires thin sections (40-50 µm) and a tight section sampling fraction (likely 1/6 or smaller). The fiber track can also be difficult to visually identify without magnification, so it may not be obvious during sectioning. As such, do not discard any tissue from the target brain area during sectioning, as you may need to search through multiple tissue series to find the section containing the track. Furthermore, flat-cleaved fiber optic implants have a relatively small effective light collection field, as mentioned previously. If you are unable to see GEFI expression directly underneath the end of the fiber track, this is cause to doubt the veracity of the signals collected from that animal.
2. Recording: Delivering Excitation Light and Recording Emitted Light

Figure 3. Labelled image of the OASIS Photometry system.
2.1 Hardware Features
Fiber photometry systems contain several key hardware components that are extremely important for researchers to have a basic understanding of. Mightex’s OASIS Photometry system is a modular, camera-based system designed to maximize user flexibility, customizability, and high-throughput experimental pipelines. Here we will review key information about each of the basic components.

Figure 4. This schematic illustrates the excitation–emission light path during a typical photometry experiment. The LED driver precisely modulates the LED light source, receiving hardware triggers and controlling trigger timing and output power. Upon activation, the LED delivers excitation light into the optical path toward the filter assembly. Within this module, dichroic and emission filters spectrally separate excitation and fluorescence signals, directing excitation wavelengths toward the sample while isolating the longer-wavelength emission containing the biological signal. The excitation light is delivered to the subject via a fiber optic patchcord connected to the photometry rig. Fluorescence emitted from the target tissue is collected through the same optical pathway, spectrally filtered to remove residual excitation light, and directed to the light detector, where the optical signal is converted into a measurable electrical output for downstream analysis.
1. Light Source
Light sources are the components that deliver excitation light into the optical path. The earliest photometry systems used lasers, which can deliver high power within a small linewidth. However, they are expensive, require enhanced safety protocols, and present a real risk of tissue heating/phototoxicity to the recording site. The OASIS Photometry system, as well as most other commercial systems, now use LEDs as the excitation light sources for recording GEFIs. LEDs deliver a broader bandwidth than lasers, but they can simply be accompanied by an emission filter to restrict the light to the intended excitation wavelength. LEDs come in many wavelengths, but photometry systems will typically use 2-3 wavelengths to account for an isosbestic channel and one or two wavelengths for recording sensor-dependent activity.
2. Light Source Driver
The light source driver provides current to drive the LED. Additionally, it triggers the LED on and off and determines how much power output is delivered. Precise control and when and how much excitation light is delivered is paramount for effective photometry experiments. Light source drivers and light sources must be compatible with respect to the maximum current output in order to sufficiently drive the LED without damaging it.
3. Dichroics and Filters
Due to the fact that multiple wavelengths of light are travelling through the optical path of the photometry rig, it is necessary to separate excitation light from emission light (the wavelength containing your signal). This is accomplished via a series of dichroic mirrors and filters. A dichroic mirror allows the passage of certain wavelengths while reflecting others. In the typical configuration for imaging a green sensor, 405 and 465 nm wavelengths are aimed at a “longpass” dichroic mirror which reflects 465 nm light and any shorter wavelengths so that these excitation wavelengths are directed into the imaging path heading towards the subject patchcord. The green emission light from the sensor, which is a longer wavelength, is able to pass through this mirror to the light detector, so that the detector sees only the emission light and none of the excitation light. However, dichroic mirrors do not reflect 100% of the light they are intended to, so an additional emission filter which only allows green light may be placed in front of the light detector to further filter the signal.
Depending on the number of wavelengths in use (including stimulation light for combined photometry + optogenetics), multiple dichroic mirrors and filters will be arranged in the light path to allow multiple excitation wavelengths to pass into the subject patchcord, with only the emission wavelengths of interest reaching the light detector.
4. Subject Patchcord
After excitation light has been generated, it must be delivered to your subject via a fiber optic connection running from the photometry rig, into the recording chamber, and into the fiber optic implant in the subject.
Fiber optic patchcords come with a variety of optical properties and various connectors. For photometry recordings, you should use a low autofluorescence fiber. Connecting the patchcord to a subject requires that one end of the patchcord has a fiber cannula with the same outside diameter as the fiber implants in your animals. This connection is secured with a metal or ceramic mating sleeve, which holds the two together via compression. The other end of the patchcord must connect either directly to the photometry system or rotary joint via an SMA connector. Patchcords with an SMA connector at both ends function to relay the optical signal to- and from the photometry system and a rotary joint. A range of core diameters is acceptable for photometry recordings (generally 200-400 µm). Larger the core diameters will offer a higher numerical aperture and more light transmission, but a larger diameter will also mean more weight and rigidness as well as more autofluorescence. The same is the case with longer versus shorter patchcords.
Subject patchcords can be single-core for imaging one site/subject, or they can be multifurcated, with multiple fiber cores to independently record multiple brain regions/animals. Multi-furcated patchcords are the means by which camera-based photometry systems are scaled to high-throughput configurations due to the ability of a single camera to detect light from multiple fiber cores. Of note, this approach means that all fiber cores receive the same pattern of LED pulses and the same level of excitation power, and LED power cannot be modulated for each animal or region. Mightex offers high-quality, multi-furcated fiber patchcords with minimal differences in light transmission across fiber cores. However, minor differences in power output tend to be inevitable, and the goal is to keep excitation power within a 5µW range.
As mentioned previously, fiber optic patchcords experience negligible power loss over the range of lengths that would be typical in a photometry recording space, so there is no downside to using long patchcords to provide as much length as is needed for your experimental setup. However, the length of the patchcord should be calibrated to allow it to lie as straight as possible, as bends in the patchcord reduce light transmission efficiency 9 in addition to interfering with animal behaviour.
5. Light Detector
After excitation light has been delivered to the subject and the emission light has been collected and filtered, the final hardware step is for the emission light to be collected and measured. Mightex’s OASIS Photometry system makes use of a scientific-grade CMOS camera, enabling simultaneous signal detection from multiple animals and/or brain regions without the need for multiple, expensive detectors. Our SBE-series monochromatic cameras contain a global shutter CMOS capable of hundreds of frames/second with high sensitivity.
This approach works by focusing the camera on the face of the fiber patchcord to collect fluorescence emitted from the fiber cores. In order to separate the emission responses to each excitation wavelength, light sources are cycled on and off in an interleaved fashion, such that individual frames of the recording only contain the emissions corresponding to one wavelength at a time. Because the CMOS detector contains a 2-dimensional pixel array, signals from multiple fiber cores can be recorded on one detector, enabling the use of multi-furcated fiber patchcords for high-throughput research applications at a relatively low cost.
2.2 Hardware Setup and Calibration
2.2.1 Designing Your Recording Space
Setting up a fiber photometry system – particularly one intended for high-throughput, simultaneous recordings – requires careful planning. Once set up, a photometry system will ideally not be disassembled or reconfigured frequently as this would require recalibration every time. This is especially the case when using multifurcated fiber bundles on a camera-based system, as disconnecting and reconnecting the fiber bundle will then require refocusing and realignment of the fiber ROIs. If your system must be portable (e.g. in the case of shared laboratory equipment/space), we recommend that you keep your system on a cart and as fully set up as possible, with multifurcated fiber branches labelled to minimize the complexity of reconnecting them to recording chambers. Your photometry system can be located on any stable surface, such as a desk, shelf, or cart, as long as you are extremely careful not to subject the fiber optic cords to physical strain such as tension or pinching. This means that you should measure your space and ensure that you have patchcords of adequate length running to your recording chambers and, if using a cart, that the cart and chambers are in a stable position so as not to tug on the patchcords or drag equipment off of surfaces.
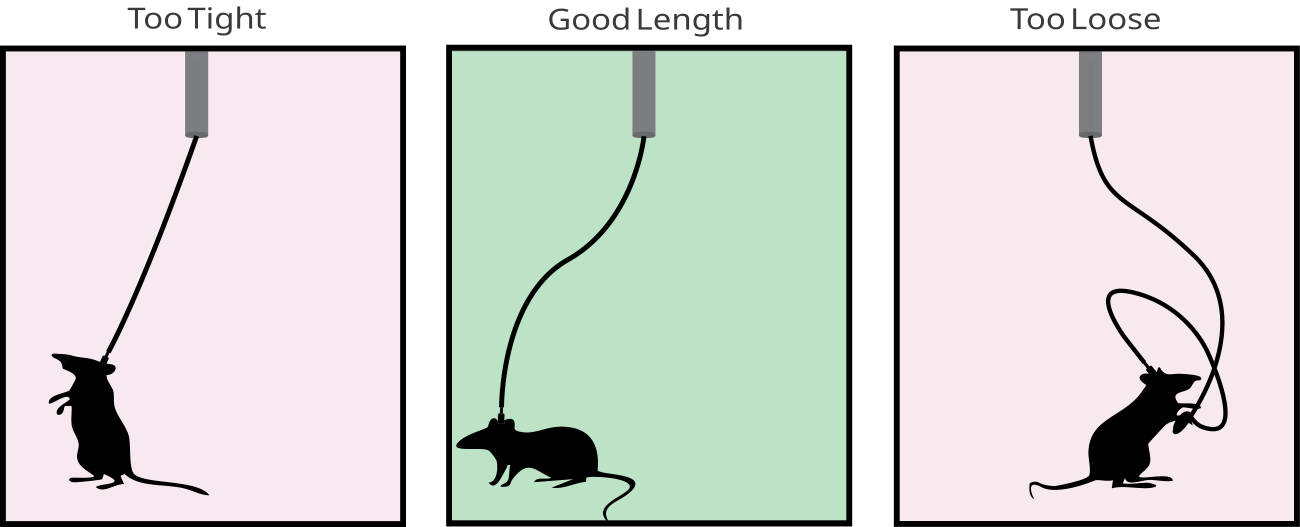
Figure 5. This illustration demonstrates the impact of patchcord length on experimental performance and animal behavior. In the left panel, a patchcord that is too short restricts movement and places strain on the animal and patchcord. The middle panel depicts an appropriately sized patchcord, providing sufficient slack to allow naturalistic movement while minimizing tension and excess drag. In the right panel, a patchcord that is too long introduces unnecessary slack, causing the patchcord to tangle and bend at extreme angles, placing strain on both the animal and the patchcord.
Using patchcords of an appropriate length is critical both to ensure that animals can physically navigate to all areas of the behavioural apparatus and to minimize stress/bending of the patchcord. The cable should be neither excessively short (for obvious reasons) nor excessively long, because added slack will exert bending stress on the patchcord, potentially causing optical artifacts and even breaking the fiber in extreme cases. Additionally, patchcords with a standard core diameter do have a degree of bending stiffness such that a patchcord under bending stress will also exert some force on your animal, which can noticeably affect the locomotor behaviour of a 25g mouse, for example. Furthermore, an overly long patchcord may make parts of it accessible to the animal to chew on and damage. Another very important consideration is twisting of the patchcord while animals navigate the recording chamber. This is often not a significant problem in many contexts, such as shorter recordings, and can often be mitigated by using long enough patchcords to compensate. If patchcord twisting presents a problem, researchers can consider using a high-quality rotary joint, such as those offered by Mightex. Fiber optic light paths experience the most power loss at junction points, with negligible power loss over the length of a single continuous fiber, so rotary joints can in principle introduce some power loss compared with simply using a longer patchcord without a rotary joint. However, if your GEFI is reliable and you are using high-quality equipment, this should not ordinarily be a huge problem.
2.2.2 Excitation Light
Pulse Patterning and Modulation
For fiber photometry to work, excitation light must be delivered in very specific temporal patterns, lest the emission signals be impossible to disentangle during analysis. The detectors used in fiber photometry systems, including Mightex’s OASIS Photometry system, are usually monochromatic in order to maximize sensitivity and dynamic range. Even if a colour camera were to be used, the activity-dependent and isosbestic channels are measured in the same range of emission wavelengths. As such, this leaves the temporal domain as the only remaining dimension along which to parse the multiple signals arising from the same fiber core. Mightex’s OASIS Photometry system uses interleaved excitation in which light sources are pulsed on and off in a staggered fashion (with the camera frame rate adjusted to match) such that each camera frame contains only a single excitation wavelength. In this case, the sample rate for each channel is a fraction of the total sample rate, which can be calculated as total frame rate multiplied by LED duty cycle.
Power Calibration
The amount of excitation power delivered by your light source must be measured and carefully calibrated. This should, at minimum, be done before every new experiment, but ideally far more often (e.g. weekly). The same power setting on an LED driver will not deliver the same intensity of excitation light across patchcords, rotary joints, and other optics, so the power must be measured at the tip of every fiber patchcord. This is not only to ensure that the intensity of excitation light is consistent between subjects, but also to continually verify that the equipment itself is intact and functioning properly. High-quality photometry equipment, when used correctly, rarely fails suddenly, but LEDs and LED drivers can be subject to performance instability or degradation. Most of all, however, the transmission efficiency of fiber optic patchcords and rotary joints can degrade substantially over time, or fail entirely, as the equipment is repeatedly exposed to the physical stresses of recording experiments. A broken fiber patchcord will often have a visible kink at the location of the break, but regardless of how visually obvious the problem is, it will manifest as a drastic drop in the baseline power detected during recording or by a light meter.
Calibrating the amount of excitation power for an experiment is a balancing act. Too little excitation power will mean that the sensor is not being sufficiently excited to reliably emit enough light to detect a signal. Too much excitation power can damage tissue, excessively bleach the sensor, and interfere with other constructs such as opsins. Moreover, higher excitation intensities will produce diminishing returns with respect to your signal:noise ratio. Determining the correct amount of excitation power is essentially a matter of finding the level of excitation power that maximizes the amplitude of sensor-dependent dynamics while minimizing photobleaching. Ali Mohebi describes an excellent method for calibrating excitation power for specific experiments 10.
2.2.3 Excitation Wavelengths
The wavelength used for the isosbestic channel is usually 400-410 nm and the wavelengths for sensor-dependent activity are usually 465-470 nm (for green sensors) and/or 560 nm (for redshifted sensors). This wavelength configuration will suffice for the majority of photometry experiments. However, the landscape of GEFIs is rapidly evolving, with recent expansion into the far-red range. Mightex’s OASIS Photometry system can be customized with additional wavelengths to expand our users’ spectral palette and enable greater multiplexing. The modular nature of our hardware enables user-friendly integration of new wavelengths without the need to replace most other elements of the base system. Some additional care must be taken when combining multiple sensors, as there can be channel bleedthrough and off-target effects of excitation light. Certain fluorophores can undergo complex photoswitching in response to certain wavelengths, presenting a potential confound in experiments using multiple excitation wavelengths. For example, some redshifted GEFIs undergo an increase in baseline brightness in response to high-intensity blue light 11.
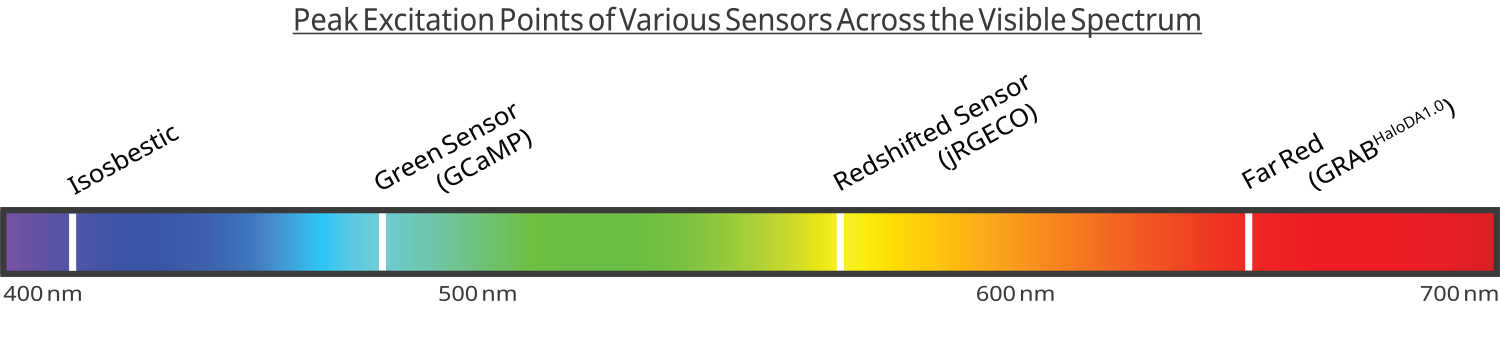
Figure 6. This schematic illustrates the excitation wavelength ranges for commonly used sensors in fiber photometry: isosbestic control (400–410 nm), green fluorescent sensors (465–470 nm), red-shifted sensors (560 nm), and far-red sensors (760-765nm).
Isosbestic Channel
At this point, it is useful to provide some detail about precisely what the isosbestic channel is, in principle, and what it does in the specific case of fiber photometry. A fundamental challenge in fiber photometry is that the amount of measured fluorescence can change in response to many factors other than GEFI activity. Obtaining the activity-dependent signal from a raw photometry recording requires the removal of these activity-independent artifacts, and an isosbestic channel is the most common way of doing so.
Speaking broadly about spectroscopy, an isosbestic point is a specific wavelength (or band of wavelengths) where the absorbance of an illuminated sample exhibits no change when compared between two or more different states, such as the different phases of a chemical reaction. GCaMP will emit fluorescence to one degree or another under a range of excitation wavelengths, but when comparing between Ca2+-bound GCaMP and unbound GCaMP under tightly-controlled conditions (e.g. cell culture electrophysiology), there are specific wavelengths where Ca2+ binding leads to a change in fluorescence (i.e. around 470nm) and other wavelengths where the emitted fluorescence appears unaffected by the presence or absence of Ca2+ (i.e. around 405nm). Hence, the isosbestic point is a fluorescent signal that is invariant to the Ca2+ binding state of the sensor. In fiber photometry, this property allows other sources of variability in fluorescence intensity to be independently collected and later removed.
The exact isosbestic wavelength and peak excitation wavelength can vary from sensor to sensor, so the standard 400-410nm isosbestic channel used in most photometry systems may not precisely target the isosbestic point of every sensor. Although it appears to be common practice in the field to use 400-410nm isosbestic excitation across multiple sensors, some researchers may desire a more specialized selection of excitation wavelengths. The exact isosbestic points for a number of sensors have been measured empirically (see Table 1 12).
Control Dyes and Sensors with No Isosbestic Point
Critically, one must verify that their GEFI of choice has an isosbestic point in the first place. There are now multiple sensors that either lack an isosbestic point, or no isosbestic point has been reported. These include some red-shifted sensors based on the fluorophore mApple 13 and the latest far-red dopamine sensor 14.
The typical method for empirically measuring and verifying a GEFI’s isosbestic point is to perform in vitro fluorescence imaging of GEFI-expressing cells, under a range of wavelengths, and in the presence or absence of the GEFI’s target ligand. The results of these experiments will typically be reported via a spectrum plot that looks something like (Figure 7) and shows relative fluorescence intensity or absorbance. GEFIs that have an isosbestic point will emit some fluorescence with an excitation wavelength offset from the ligand+ emission peak, and the intensity of this fluorescence will be equal with or without ligand binding.
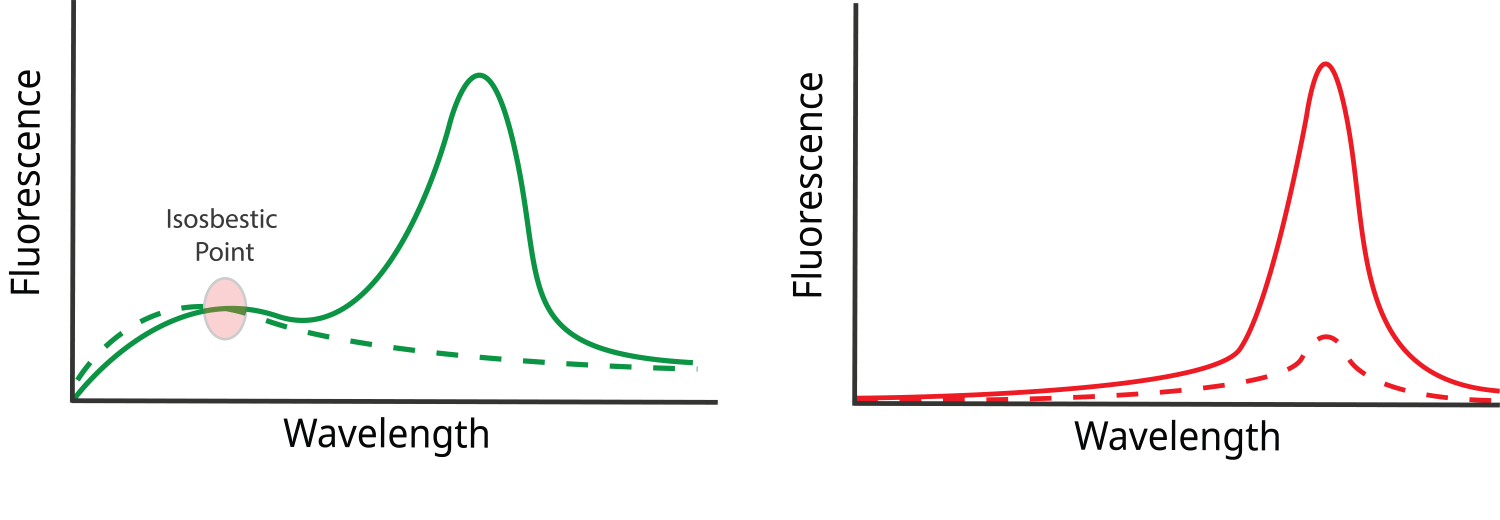
Figure 7. Illustration of single-photon spectrum plots. A sensor is expressed in cell culture and illuminated under a range of wavelengths in the presence (solid line) or absence (dashed line) of the sensor’s ligand. In the left panel, a clear isosbestic point is visible where the sensor’s brightness is equivalent both in the presence and absence of the ligand. In the right panel, no clear isosbestic point is apparent.
The lack of an isosbestic point has major implications for how motion and photobleaching are corrected. Attempting to use a typical isosbestic wavelength (e.g. 405nm) to correct artifacts would fail to meet some of the basic assumptions of an isosbestic channel. If the GEFI emits little or no activity-independent fluorescence under 405nm illumination, then activity-independent fluctuations in GEFI brightness are unmeasurable by these means. Some signal may still be observable, but this would reflect, for example, tissue autofluorescence rather than the GEFI itself.
The current fiber photometry research literature describes at least 3 general approaches to work around this challenge. The first is to express a control dye that falls within a different spectral range from the GEFI 15 and use it similarly to an isosbestic channel. The brightness of this control dye will have no activity-dependent dynamics, but will reflect motion artifacts, pH fluctuations, and other sources of noise. A second approach, applicable in multi-colour photometry experiments, is to use the isosbestic point of one of the GEFIs to correct artifacts for the other GEFI 16. The third approach is to forego the use of a control channel entirely 14. Although this approach carries the risk of very noisy data, it can work under the right conditions, such as experiments in which an experimental manipulation causes very large changes in the signal that can overcome the noise.
2.3 Conducting Recordings
2.3.1 Preparing Your Photometry Rig
Before conducting recordings, you should run through some prerecording procedures to ensure your system is ready to record:
- Photobleaching to mitigate patchcord autofluorescence: The materials within fiber optic patchcords have autofluorescent properties. We always recommend that photometry be conducted with low-autofluorescence patchcords. Nonetheless, it is always best practice to photobleach your patchcords before recording. This is accomplished by running your excitation light at high power for at least one hour prior to each recording session
- Verify your optical path: Make sure that you are delivering light through all of your fiber cores and, ideally, measure the power emitting from each fiber tip using the method previously described. If the power is unusually uneven across different fiber cores, it can be an indication that a component of the optical path is broken or misaligned.
- Verify your software settings: Mightex’s OASIS Photometry system is controlled by our PolyScan software, which includes a number of user-defined configurations. This includes LED intensity, TTL triggers for synchronization with behaviour equipment, and fiber core ROIs. Our camera-based system images all cores simultaneously with a single detector, so the separation of individual signals is accomplished by manually defining the ROI for each fiber core within the camera settings. Any time a fiber patchcord is disconnected and reconnected to the base system, this changes the alignment of the fiber face relative to the camera’s detector. If your photometry system has multiple users, there is always a chance that a patchcord could have been changed without your knowledge. You will need to redraw your ROIs any time you disconnect and reconnect the patchcord from the OASIS base system (hence why you should avoid unnecessary disconnection/reconnection for the sake of convenience).
2.3.2 Connecting and Disconnecting Animals
Animals must be connected and disconnected from the patchcord carefully, there must be a flush interface between the tip of the patchcord and the implanted fiber, and the connection must be snug and secure with a properly-fitted mating sleeve. You will also need to make sure you have an available surface, within the length of the imaging patchcord, to scruff your mouse when detaching the fiber. When connecting or disconnecting an animal, the proper technique is to firmly grasp the tip of the patchcord where the mating sleeve covers the cannulae and gently twist to ease the mating sleeve on and off the implanted fiber. This technique minimizes stress to the headcap/skull interface. Do not pull via any flexible part of the patchcord. Anecdotally, headcaps are more resilient to torsion stress perpendicular to the skull surface than they are to tension. If you simply pull the patchcord off the animal, you risk pulling the headcap off with it, and if the patchcord detaches easily via this method, it likely means that your mating sleeve is too loose.
3. Signal Procesing
3.1 Preprocessing
Isolation of Separate Fluorescence Channels
Once the raw photometry has been collected, it must be separated into individual channels for analysis. Due to the fact that the signal is composed of emissions from a minimum of 2 excitation wavelengths through a single fiber, these signals must be separated in the temporal domain. In camera-based photometry systems such as those offered by Mightex, LEDs are pulsed on and off in an “interleaved” fashion, with one LED active at a time. The camera frame rate is also adjusted to match LED pulses so that each frame contains only one wavelength. Individual signals are generated by “deinterleaving” the raw recording, meaning that camera frames from each wavelength are separated and concatenated into separate timeseries. You can read a more detailed explanation of this on the MightexBio Blog: Fiber Photometry Data Preprocessing: Deinterleaving Signals and Fixing Dropped Frames.
Denoising and Temporal Downsampling
Raw photometry signals may be collected at sampling rates that are unnecessarily high given the underlying kinetics of a GEFI. As such, it is a common practice to temporally downsample and filter the signal of unnecessary frequencies. Photometry traces can be downsampled via decimation (keeping every e.g 10th frame and discarding the others) or binning (taking average values across blocks of multiple frames). High-frequency noise (such as electrical hum) is removed using a low-pass filter with a cutoff frequency determined relative to the speed of GEFI kinetics (e.g. 2-10 Hz for GCaMP). Multiple types of low-pass filter exist, with some being popular for use in photometry such as a Butterworth filter. Recently, researchers have begun recommending that a zero-phase filter is most advantageous due to the fact that it causes minimal distortion of the signal13. Aside from high frequency noise, other kinds of artifact arising from electrical interference can be removed using a median filter.
However you decide to filter and/or downsample your signal, there are some key points to consider. The parameters that you use to perform these procedures must account for the underlying kinetics of your GEFI of choice and the biological signal you are trying to record. Calcium dynamics are much slower than voltage dynamics, for instance, so the sampling frequency you use to record calcium will not be sufficient for voltage recordings. In any case, a useful metric here is the Nyquist theorem, which can be summarized as such: Reconstruction of a continuous signal from discontinuous samples requires that samples are collected at a minimum of twice the frequency of the signal’s fastest component. Sampling rates below this Nyquist value can lead to temporal “aliasing”. You will likely have seen examples of aliasing before, such as videos of spinning helicopter rotors where the blades appear to be immobile or move slowly or backwards. Aliasing occurs because high frequency events are only partially sampled and accumulate in the signal as low-frequency features. Although the bulk signal collected via fiber photometry is the sum of many asynchronous events across many cells, obscuring the kinetics of single cell activity, it is not inconceivable that for brief periods of reduced activity, the signal may contain only a single cell. Ideally, your denoising and temporal downsampling parameters ought to be based on the fastest components of single cell activity. It is also worth emphasizing that denoising must be done before any temporal downsampling or this can lead to aliasing.
4. Conclusion
Having followed the advice described in this eBook, you should now have much of the knowledge required to collect high-quality fiber photometry data, correctly preprocess it, and have processed traces ready for data analysis. The analysis and interpretation of fiber photometry data is a topic unto itself which will be explored in a future eBook.
If you found this eBook enlightening, we encourage you to have a look at our other eBooks, Application Notes, and to stay tuned for future releases. The Mightex team is made of experienced researchers from behavioural neuroscience and other biomedical fields. We continually produce new content to bring these fascinating topics to a wider audience and empower our customers with the knowledge to conduct the highest-quality research possible.
References
- Hrvatin, S. et al. Neurons that regulate mouse torpor. Nature 583, 115–121 (2020).
- McMahon, S. M. & Jackson, M. B. An inconvenient truth: Calcium sensors are calcium buffers. Trends Neurosci. 41, 880–884 (2018).
- Masala, N. et al. Aberrant hippocampal Ca2+ micro-waves following synapsin-dependent adeno-associated viral expression of Ca2+ indicators. eLife (2024) doi:10.7554/elife.93804.2.
- Grienberger, C. & Konnerth, A. Imaging calcium in neurons. Neuron 73, 862–885 (2012).
- Gasterstädt, I. et al. Genetically encoded calcium indicators can impair dendrite growth of cortical neurons. Front. Cell. Neurosci. 14, 570596 (2020).
- Resendez, S. L. et al. Visualization of cortical, subcortical and deep brain neural circuit dynamics during naturalistic mammalian behavior with head-mounted microscopes and chronically implanted lenses. Nat. Protoc. 11, 566–597 (2016).
- Yang, Y. et al. Improved calcium sensor GCaMP-X overcomes the calcium channel perturbations induced by the calmodulin in GCaMP. Nat. Commun. 9, 1504 (2018).
- Pisanello, M. et al. The three-dimensional signal collection field for fiber photometry in brain tissue. Front. Neurosci. 13, 1–16 (2019).
- Lustermann, B. et al. Experimental determination and ray-tracing simulation of bending losses in melt-spun polymer optical fibres. Sci. Rep. 10, 11885 (2020).
- Mohebi, A. LED power tuning for fiber photometry – Diamonds in the rough. Diamonds in the rough https://blog.mohebial.com/led-power-tuning-for-fiber-photometry/ (2022).
- Wu, J. et al. Improved orange and red Ca2+ indicators and photophysical considerations for optogenetic applications. ACS Chem. Neurosci. 4, 963–972 (2013).
- Simpson, E. H. et al. Lights, fiber, action! A primer on in vivo fiber photometry. Neuron 112, 718–739 (2024).
- Deng, F. et al. Improved green and red GRAB sensors for monitoring spatiotemporal serotonin release in vivo. Nat. Methods 21, 692–702 (2024).
- Zheng, Y. et al. In vivo multiplex imaging of dynamic neurochemical networks with designed far-red dopamine sensors. Science 388 (2025).
- Meng, C. et al. Spectrally resolved fiber photometry for multi-component analysis of brain circuits. Neuron 98, 707–717 (2018).
- Skirzewski, M. et al. Continuous cholinergic-dopaminergic updating in the nucleus accumbens underlies approaches to reward-predicting cues. Nat. Commun. 13, 7924 (2022).